Puget Sound Lidar Consortium


A crude example of lidar-based forest analysis to illustrate the kind of detailed forest characterization that is possible with the PSLC data

    10.5" high x 36" wide poster of images below
        13 MB zip file, unzips to 43 MB Postscript file for HP2500CP plotter
        0.5 MB pdf file

All images are of a 1 x 1.4 km area west of Tahuya, on the SW corner of the Kitsap Peninsula, Mason County, Washington. Lidar data were acquired with a multiple-return laser altimeter, 0.9 m footprint, +/- 18 degree scan angle.
 
USGS DOQQ (digital ortho-quarter-quad). 
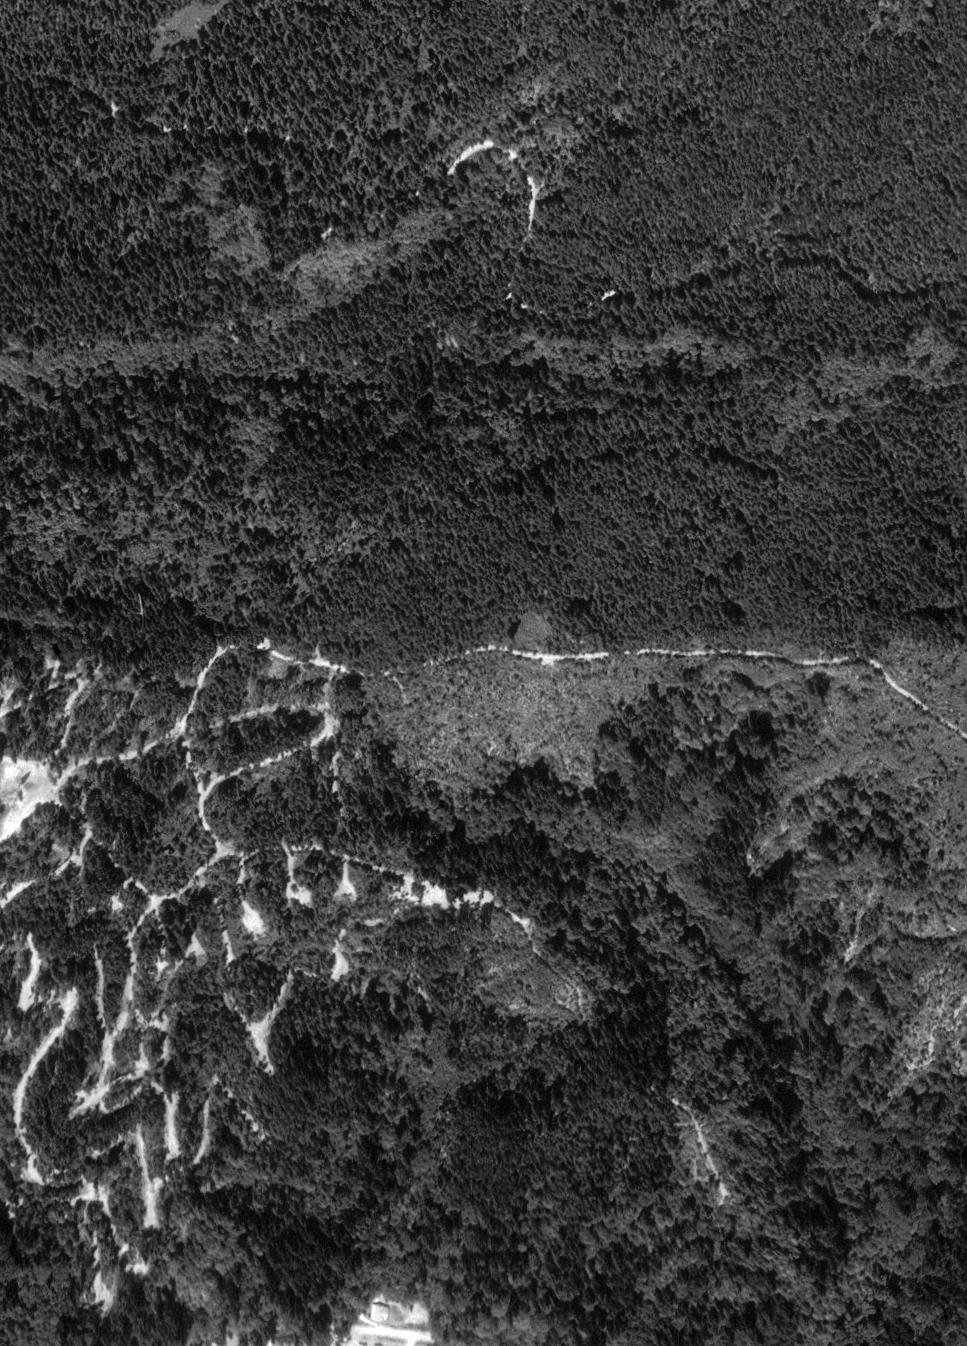
1-meter black and white pixels in original, from 1:40,000-scale aerial photography.

Click image to see larger version (284 KB)

1st-return surface, calculated from lidar data. A grid sampled from a TIN of all 1st returns

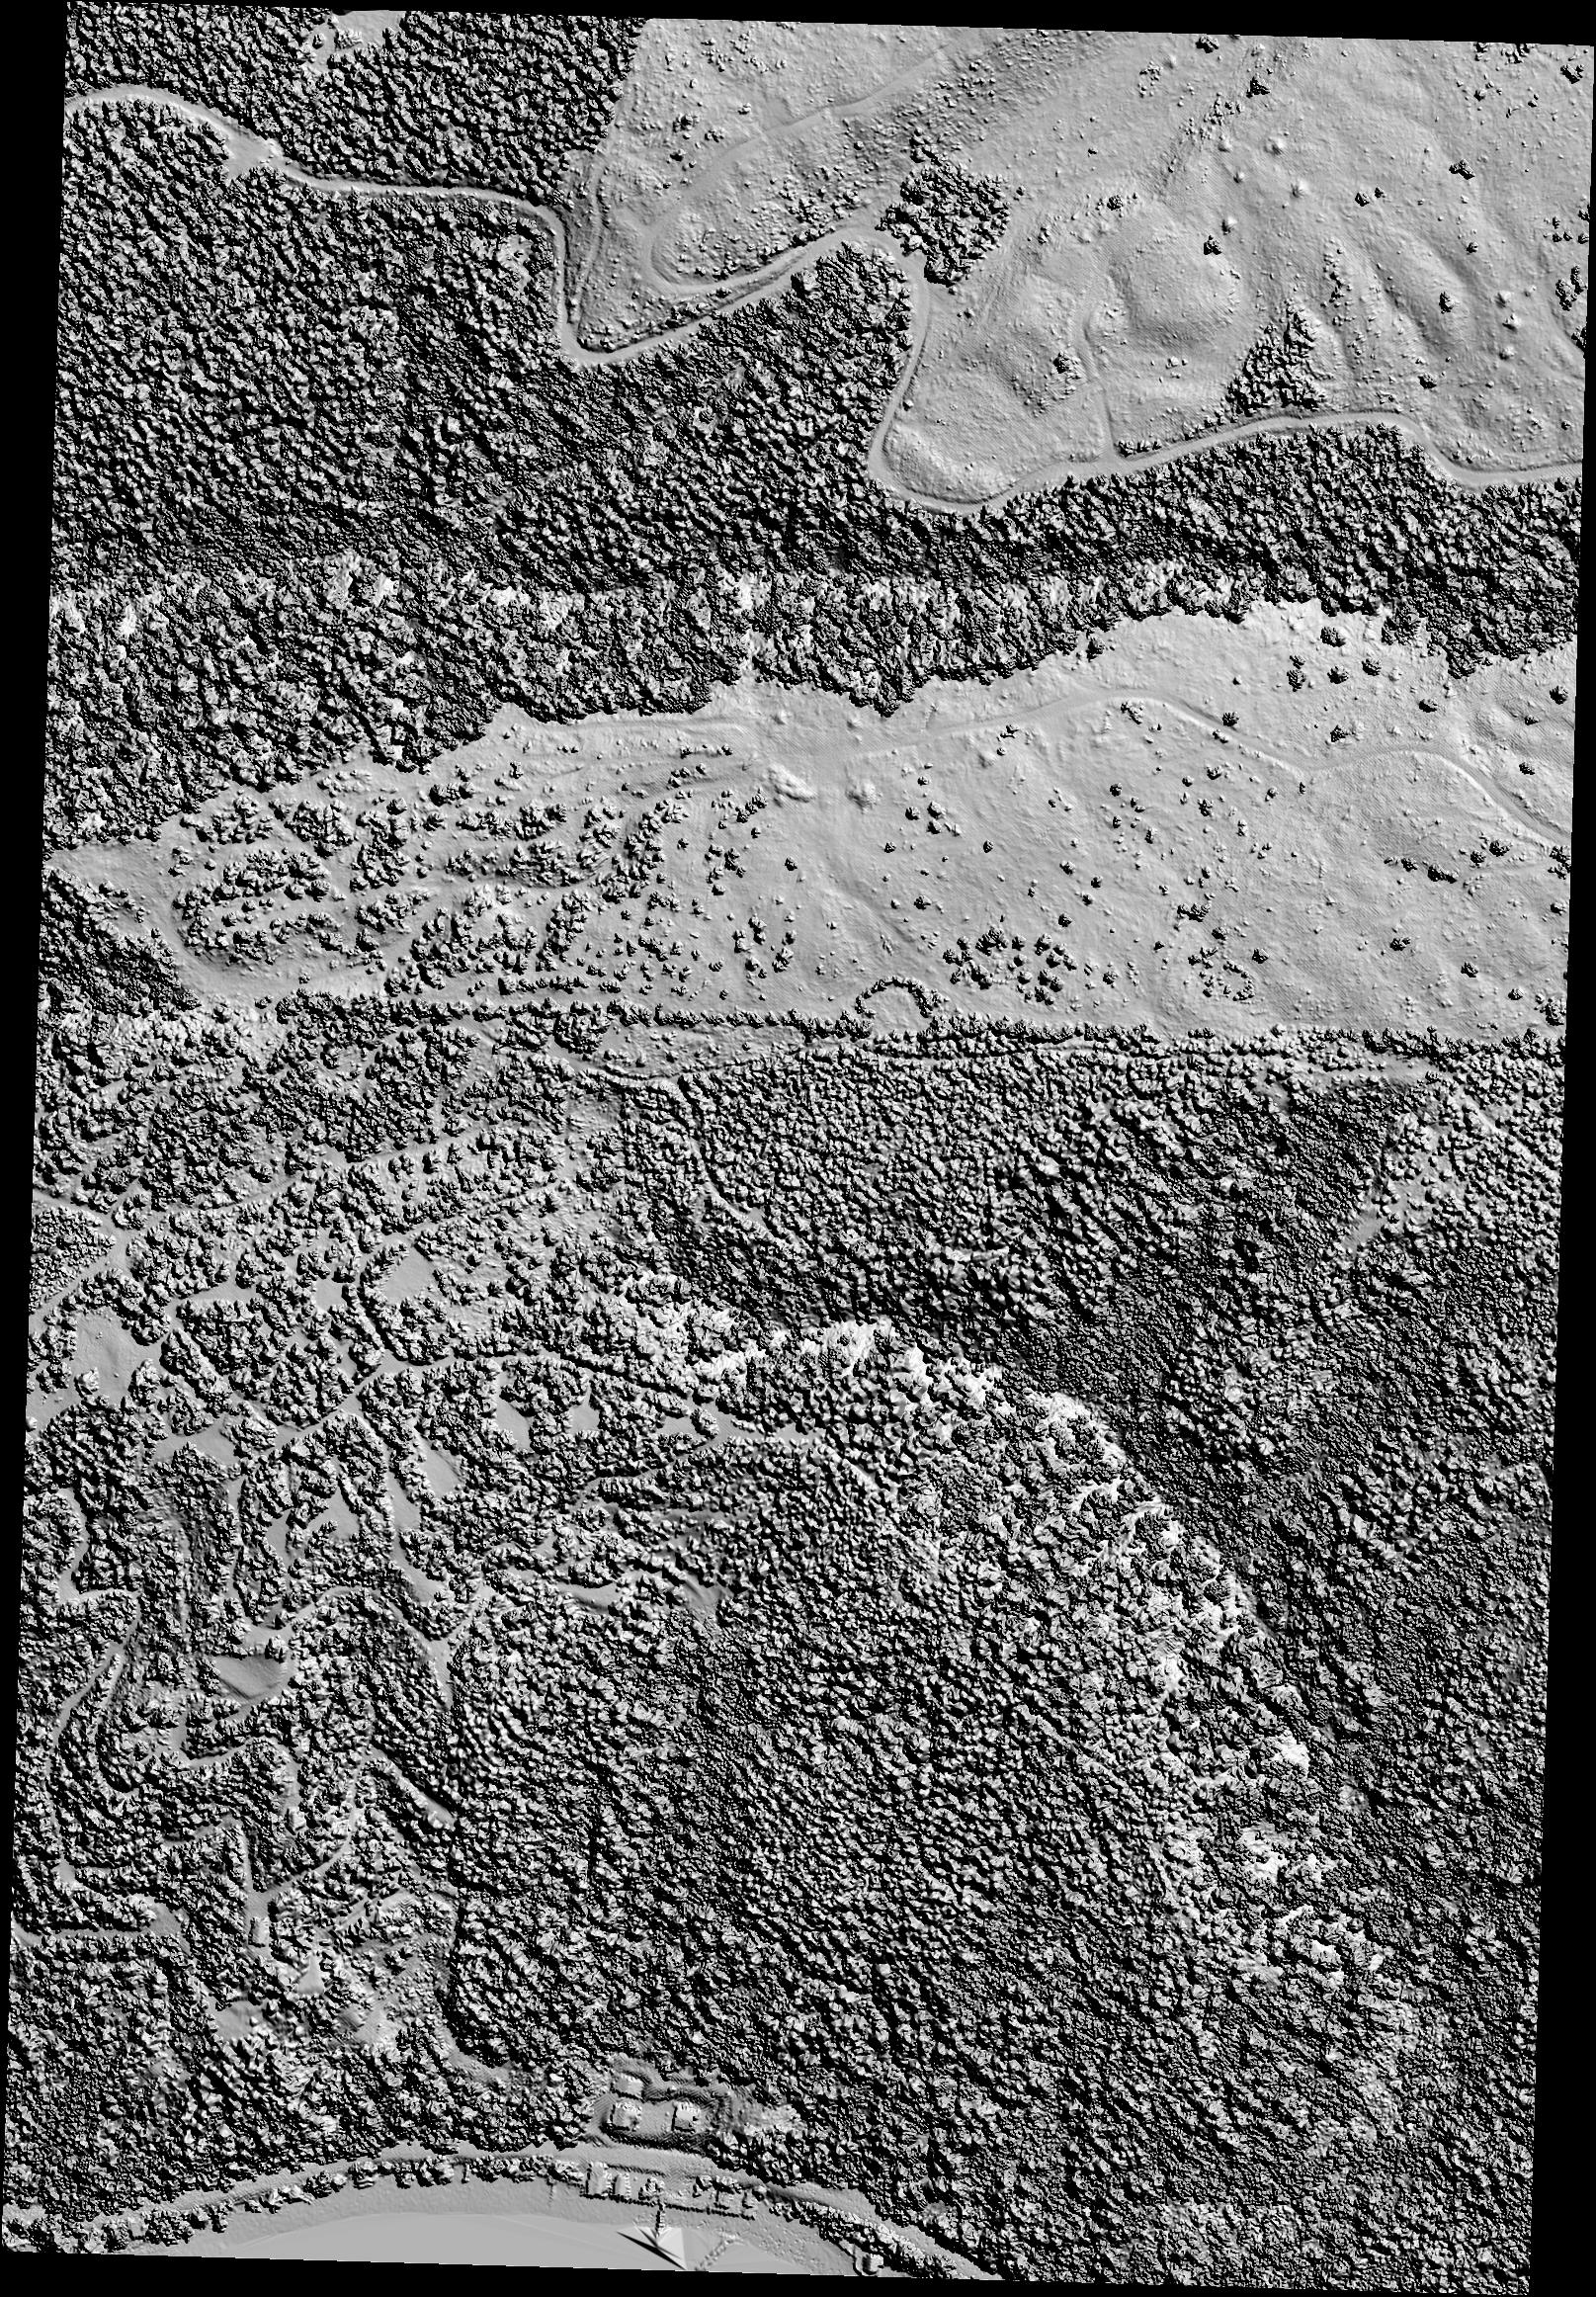
Click image to see larger version (1.54 MB)

Bare-earth surface, produced with Haugerud's despike VDF algorithm.

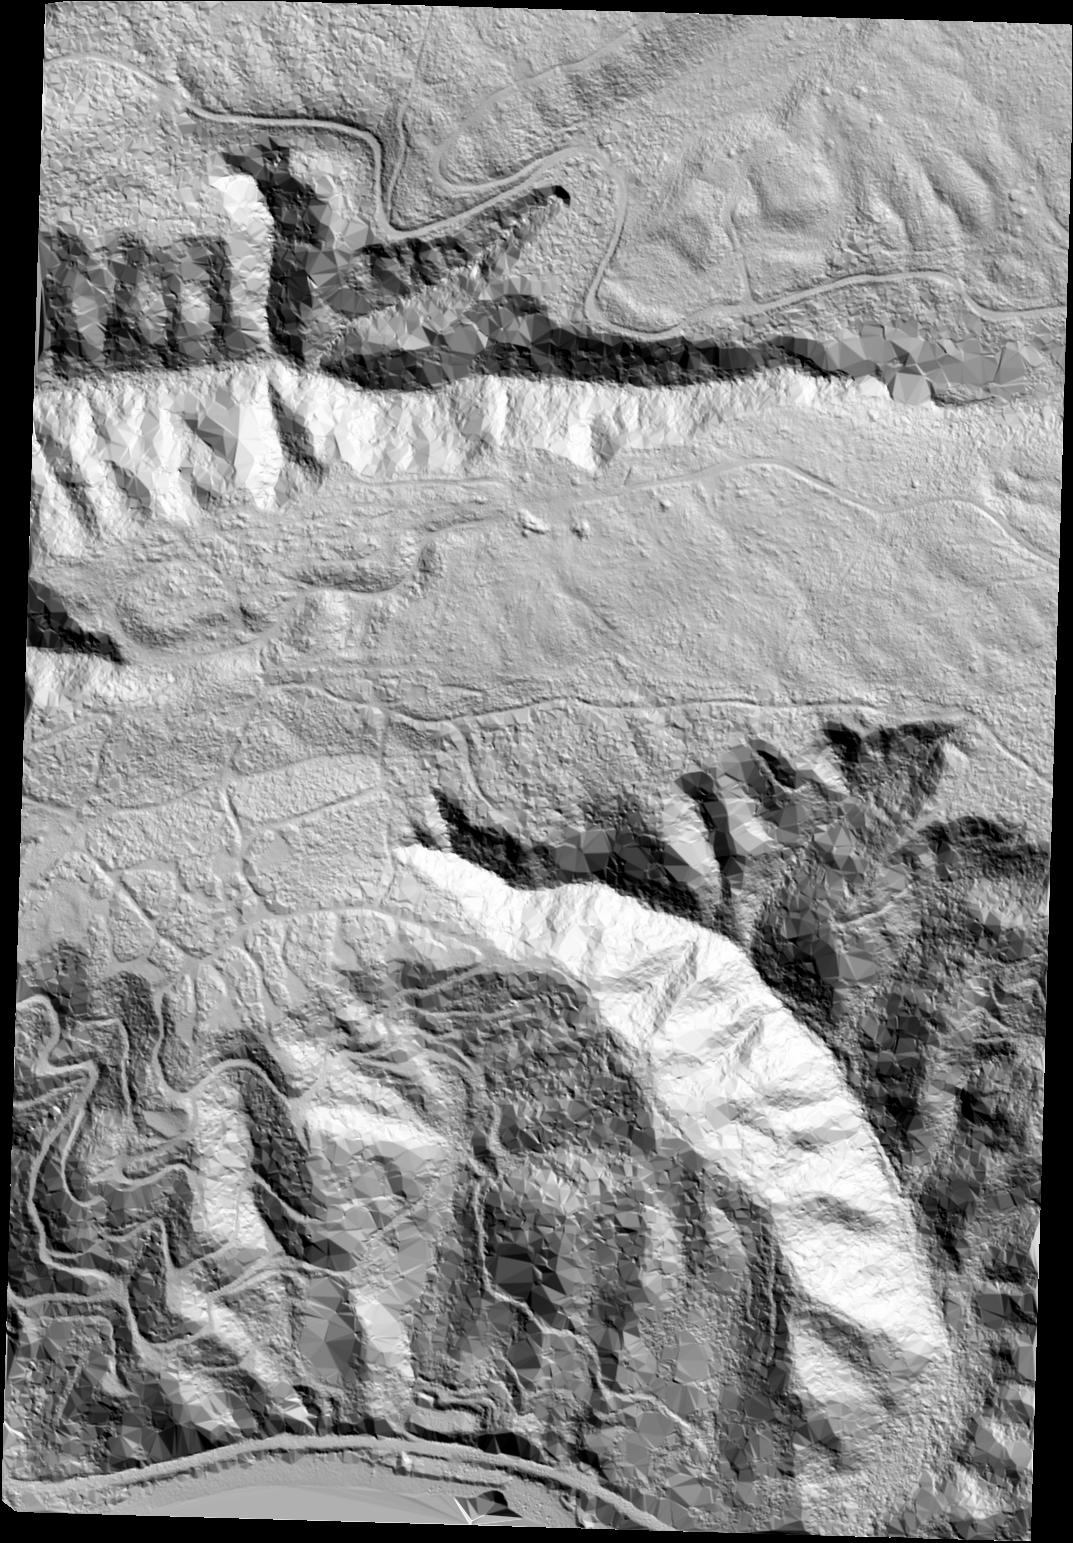
Click image to see larger version (325 KB)

"Canopy height", 1st-return surface minus bare-earth surface.

Blue = tall  red = short  (Hue = 2 x height in feet)

Note that there are sampling issues with this surface. The laser beam may not have intercepted the top of each tree. Or the top is not big enough to generate a bright enough reflection to trigger the detector.

Click image to see larger version (778 KB)

To avoid these sampling issues, it is useful to aggregate returns over larger cells--here, cells 10 meters square--and look at some sort of average value. Colors correspond to the 90th percentile height of non-ground 1st returns in each cell. This analysis was inspired by
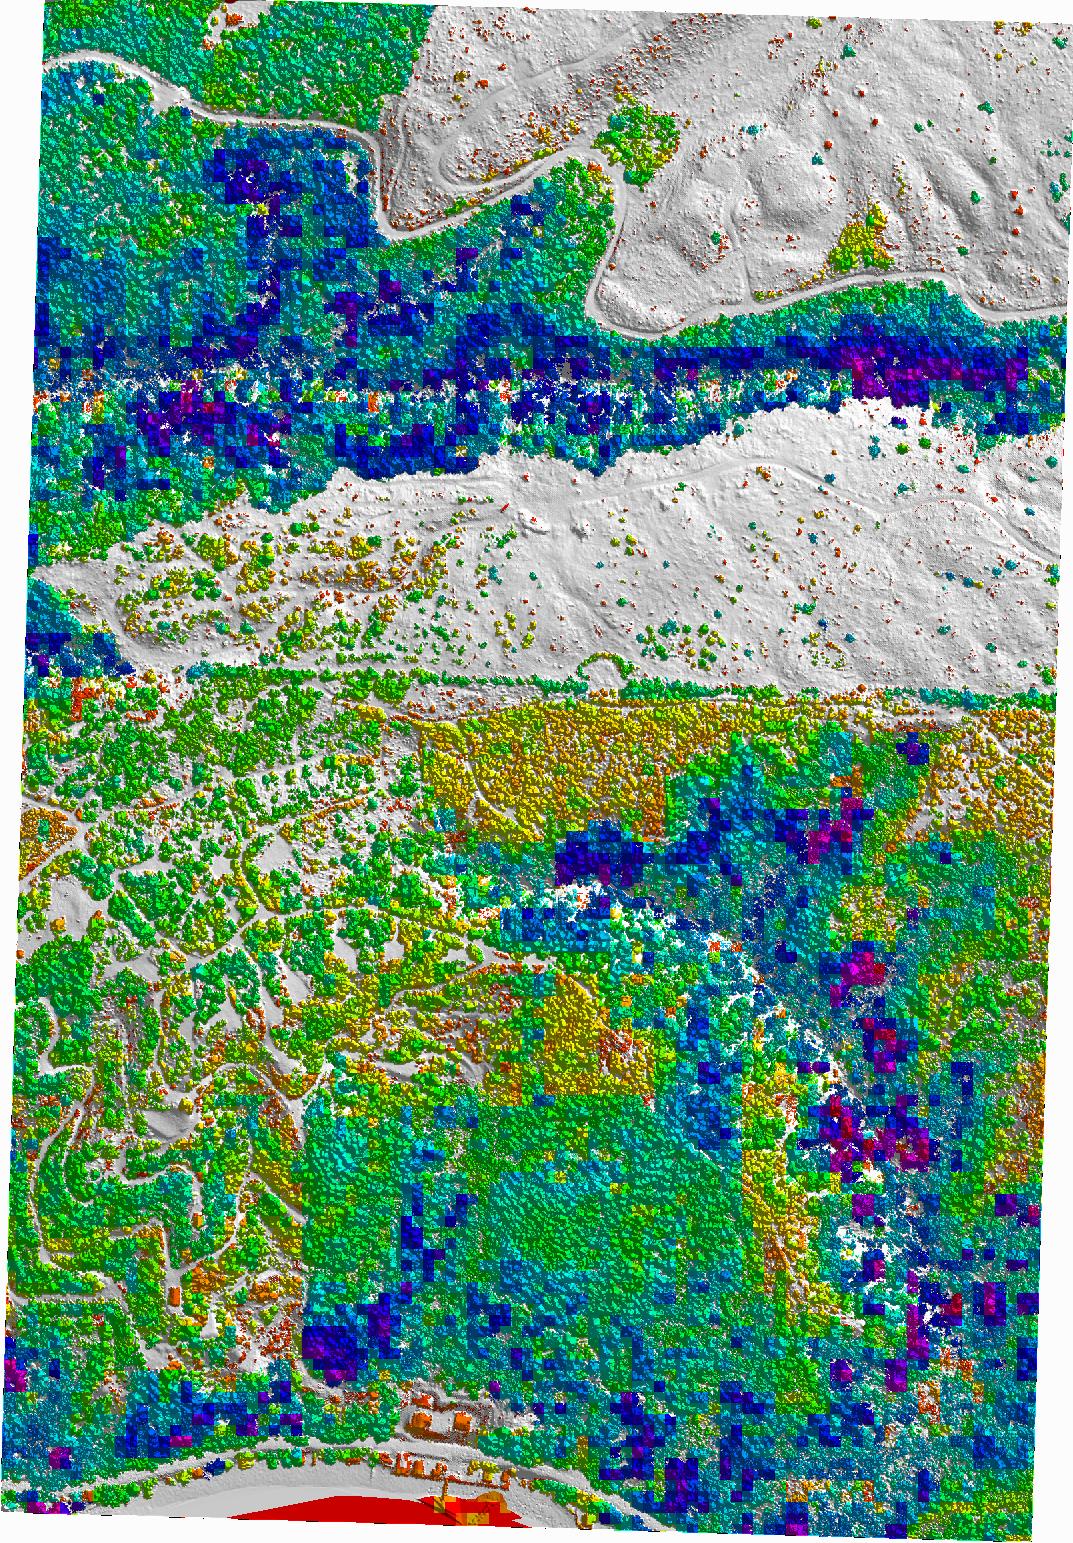
J.E. Means and others, 2000, Predicting forest stand characteristics with airborne scanning lidar: Photogrammetric Engineering and Remote Sensing, v. 66, n. 11, p. 1367-1371
Blue = tall  red = short  (Hue = 2 x height in feet)

Click on image to see larger version (715 KB)

The percentage of 1st returns that are not from the ground--a crude measure of canopy coverage
red = no canopy 
yellow = 30% canopy cover
green = 60% canopy cover
cyan = 90% canopy cover

Click on image to see larger version (639 KB)

Oblique aerial view of SW part of area shown above, from Washington Dept. of Ecology's Shoreline Aerial Photos server, http://www.ecy.wa.gov/apps/shorephotos/index.html

Click on image to see larger version (69 KB)

Download zipped tar file of Arc-Info AML, with Unix system calls, and Pascal filter, with source code, used for this analyis (canopy.tar, 23 KB)


This page maintained by PSLC webmaster --- Last updated : Tue Oct 30 11:19:59 2001