Puget Sound Lidar Consortium
Geomorphic (surface) mapping
The landscape, carefully observed, tells the story of its own making.
Glacially scoured upland, diffusionally softened ridgecrest, landslide,
alluvial river bottom--collectively they record a sequence of processes
and events that led to the present landforms. The hills are not unchanging!
An effective way to read the landscape is to make a geomorphic map
that shows the distribution of different surface units. The map guides
and documents interpretations of the age and genesis of these units. Geomorphic
maps are not geologic maps, as they do not show the distribution of rocks
and sedimentary deposits. Where surface units correspond to underlying
rocks or sediments, the geomorphic map is a useful proxy for a geologic
map. The geomorphic map can also show parts of Earth history that the geologic
map is blind to: geologic maps are limited by the depositional record,
whereas geomorphic maps can demonstrate history that leaves an erosional
record only.
Traditionally, geomorphologists (geologists who study the shape of the
land) examined the landscape with their own eyes in the field and indirectly
via air photos and topographic maps. This has been an imprecise process
because these tools, especially in wooded areas, have not fully shown the
shape of the land. Transferring interpretations from a field view or a
photo to a base map is tedious and often imprecise. Lidar topography--accurate,
highly detailed, fully geo-referenced, and digital--will revolutionize
interpretation of the landscape.
click images for larger views
 |
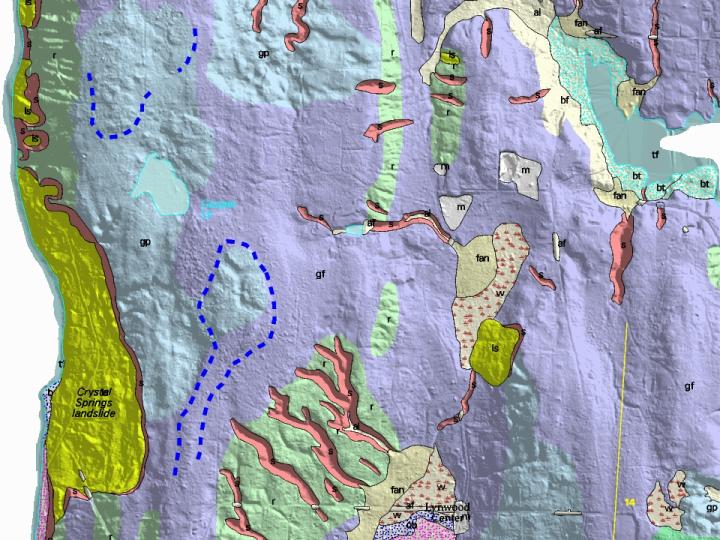
Part of a draft geomorphic map of Bainbridge Island, by
R. Haugerud, that identifies different surfaces on the basis of their morphology,
position, and relative geometry.
Yellow areas are large, deep-seated landslides. This map provides the
most complete and consistent inventory of large landslides yet created
for any part of the Puget Lowland.
During the last ice age, a thick sheet of ice flowed south across the
Puget Lowland. At the latittude of Seattle and Bainbridge Island, the ice
sheet was as thick as 3,000 feet. Flowing ice made distinctive N-S flutes,
or scour marks, that are visible on the map fragments here and on a 290
kB shaded-relief image of Bainbridge Island. |
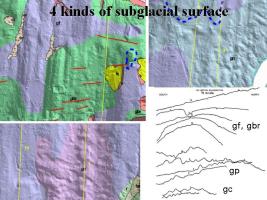 |
4 kinds of subglacial surface are evident on Bainbridge.
Glacially fluted surface (unit gf)
is typical of most of the Puget Lowland. Locally, transverse ribs (some
identified with red lines at left) underlain by less-easily-eroded conglomerate
indicate that the fluting is developed on bedrock (unit gbr,
glaciated bedrock). In places the fluting is disrupted and the surface
appears pockmarked (unit gp).
Elsewhere flutes are modified by transverse ripples (unit gc).
Profiles of these surfaces are shown at lower right, 10X vertical exaggeration. |
 |
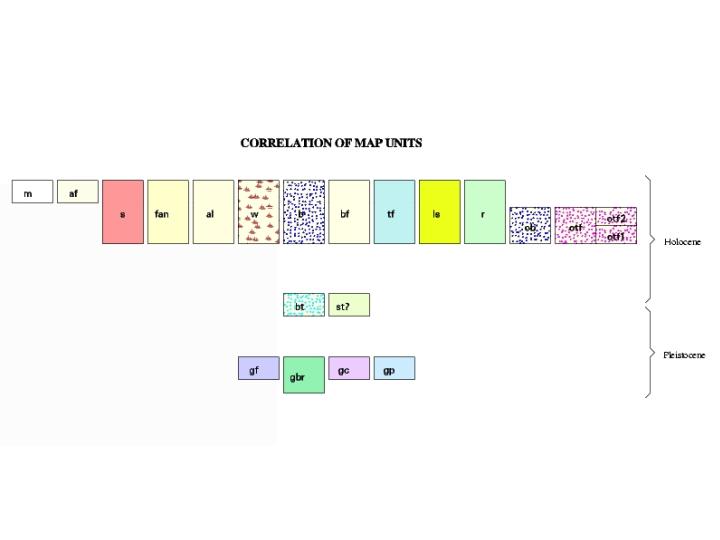
The vertical axis on this Correlation of Map Units diagram
from the Bainbridge geomorphic map shows relative age with oldest
at the bottom. Ages are assigned largely on the basis of geometric relations
between mapped units. |
This page maintained by PSLC webmaster