May, 2006
Diana M. Martinez, PSRC, dmartinez@psrc.org
This report examines the vertical accuracy of the LiDAR data for the projects in the Lower Columbia River in Washington and Oregon. The projects were originated by Washington DNR, COE, DOI and DOGAMI. TerraPoint collected the data during winter 2005. The LiDAR bare earth Digital Elevation Models (DEM) were evaluated against 180 ground control points (GCPs).
Method:
The accuracy specification in the contract between the Puget Sound LiDAR Consortium and Terrapoint is based on a required Root Mean Square Error (RMSE) ‘Bare Earth’ vertical accuracy of 30 cm for flat areas in the complete data set. This is the required result if all data points in flat areas were evaluated. Because only a small sample of points is evaluated, the required RMSE for the sample set is adjusted downward per the following equation from the FEMA LiDAR specification (adjusted from the 15 cm RMSE in the FEMA specification to 30 cm to accommodate the dense vegetation cover in the Pacific Northwest).
The vertical accuracy of the LiDAR DEMs was evaluated by finding the
difference between the ground control points (GCP) and the LiDAR bare
earth
DEM. Since the 30 cm vertical accuracy is required only for bare
and flat areas, only GCPs that are in such areas could be used.
Three
methods where used to identify these points: (1) calculate
the surface curvature at that point, (2) calculate the slope and (3)
visually
check that the GCP is not in a forested area. The maximum
acceptable
value for curvature is 3 (0 is flat land and +/-3 is moderate relief)
and
for slope is 10 (0 to 90 deg. scale). The results of the
curvature
and slope operations indicated whether the point was suitable for the
RMSE
calculation or if the point needed to be visually inspected before
being
included. Since most of these GCP are located on roads or near
roads
(as oppose to plain open areas), the curvature and slope values
may
exceed the maximum acceptable values, but still qualify if they are not
under tree cover or on rough steep terrain. If available, control
point physical description and photos are also used in determining the
suitability of the individual points.
Point Selection Process and Preparation for RMSE Evaluation:
69 Points from the Washington DOT (map)
69 points were extracted from WA DOT online monument database (
http://www.wsdot.wa.gov/monument/).
Some of these points were adjusted for being in a DOT case-and-cover,
which
puts them 23 cm below the surface unless otherwise noted. Other
points
were adjusted for listed distances above or below the surface.
The
number of points that fell inside the project areas was much greater
than
69, but many had horizontal coordinates with poor accuracy of +/- 10
meters.
Some points could not be used because they were located on bridges, on
steep slopes, in vegetated area and some had been destroyed by
construction.
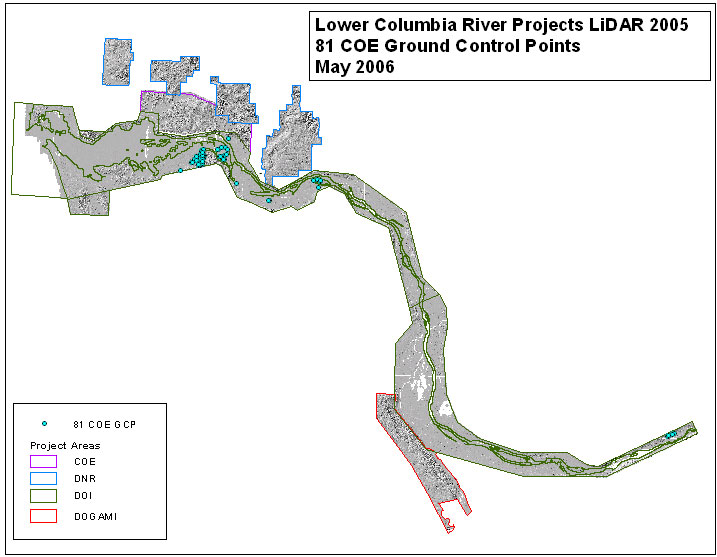
81 pts from the Corp of Engineers (map)
COE provided 128 points from their survey monument database.
I used 81 of these points for our RMSE calculations. The other
points
did not qualify because they were either outside our project area or
they
were in non-suitable locations. Some points were in NAD27
horizontal
datum and some points were is NGVD29 vertical datum. I adjusted
these
points by reprojecting the ones in NAD27 to NAD83 HARN. Then I
used
Vertcon from the National Geodetic Survey
(http://www.ngs.noaa.gov/TOOLS/Vertcon/vertcon.html)
to adjust the elevation from NGVD29 to NAVD88.
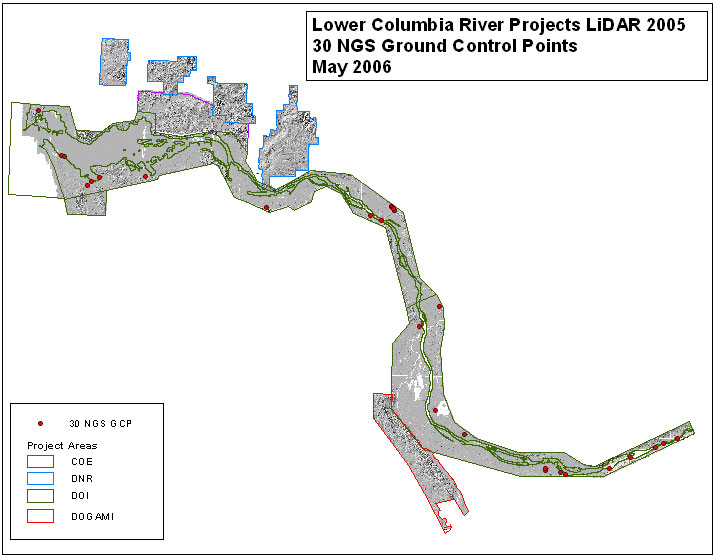
30 pts from National Geodetic Survey (map)
I received 55 NGS control points for the project area from the
Bonneville
Power Administration. BPA downloaded them from the NGS
website.
Only 30 of them were suitable for evaluating the vertical
accuracy.
The other points were located under heavy vegetation or on structures
that
were removed from the ground surface.
Finding enough suitable GCPs was not an obstacle for the DOI project area, which is mostly along the river corridor. The other areas did not have as many existing control points, specially the DOGAMI project. A better distribution of points in these areas is preferable but we couldn't find any more existing control points.
See below for details on each point.
Summary and RMSE calculation for 180 GCP:
After each point was evaluated for suitability and individual
vertical
error, they were aggregated to calculate the Root Mean Square
(RMS).
The RMSE specification for 180 points is 27.192cm and the resulting RMS
from the 180 points is 16.711cm The RMS is by far less than
the maximum RMSE in the spec, therefore the projects passes the RMSE
test.
The mean error is calculated at 5.784cm, which is very close to zero
and
that is reassuring.
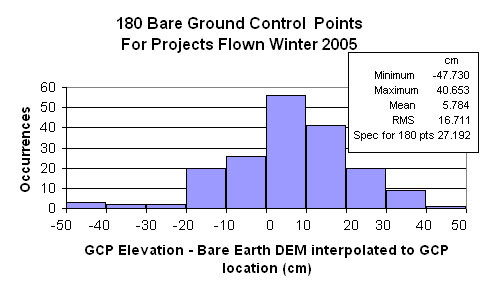
- The evaluation results show that the points form a bell shaped curb with normal distribution centered close to 0, between 0 and 10. Having an even number between -10 to 0 and 0 to 10 would be best, but the results are very good for this number of points.
- The physical distribution of the points is good for the river corridor. Points are not well distributed in the other project areas.
- Because there was several projects in close proximity in the
Columbia
River area, we decided to evaluate all of them as one project.
This
is acceptable because they were all flown in the same time period,
winter
2005, and also many of the flight lines cover adjacent projects..
Detailed results for each ground control point showing its location on the bare earth and the top surface.
Definitions:
GCP
ID
Unique identifier for each point. It identifies the source of the
point and the number
QQuad
USGS quarter quad where the GCP
GCP Elev
(ft)
GCP Ortho Elevation in ft
DEM Elev
(ft):
DEM Ortho Elevation in ft
GCP - BE DEM (ft) Elevation
differenced
between the GCP and the BE DEM ( GCP minus BE DEM). feet
GCP - BE DEM (cm) Elevation differenced between
the GCP and the BE DEM ( GCP minus BE DEM). cm
Curvature
Curvature value at the GCP
Slope
Slope at the GCP
Included
Was it was included in the RMSE calculations?
For some points I have included specific notes about why that point was disqualified.
GCP sources: